Most Recent
Most Popular
Highest Rated
Reset


Lessons
view all ⭢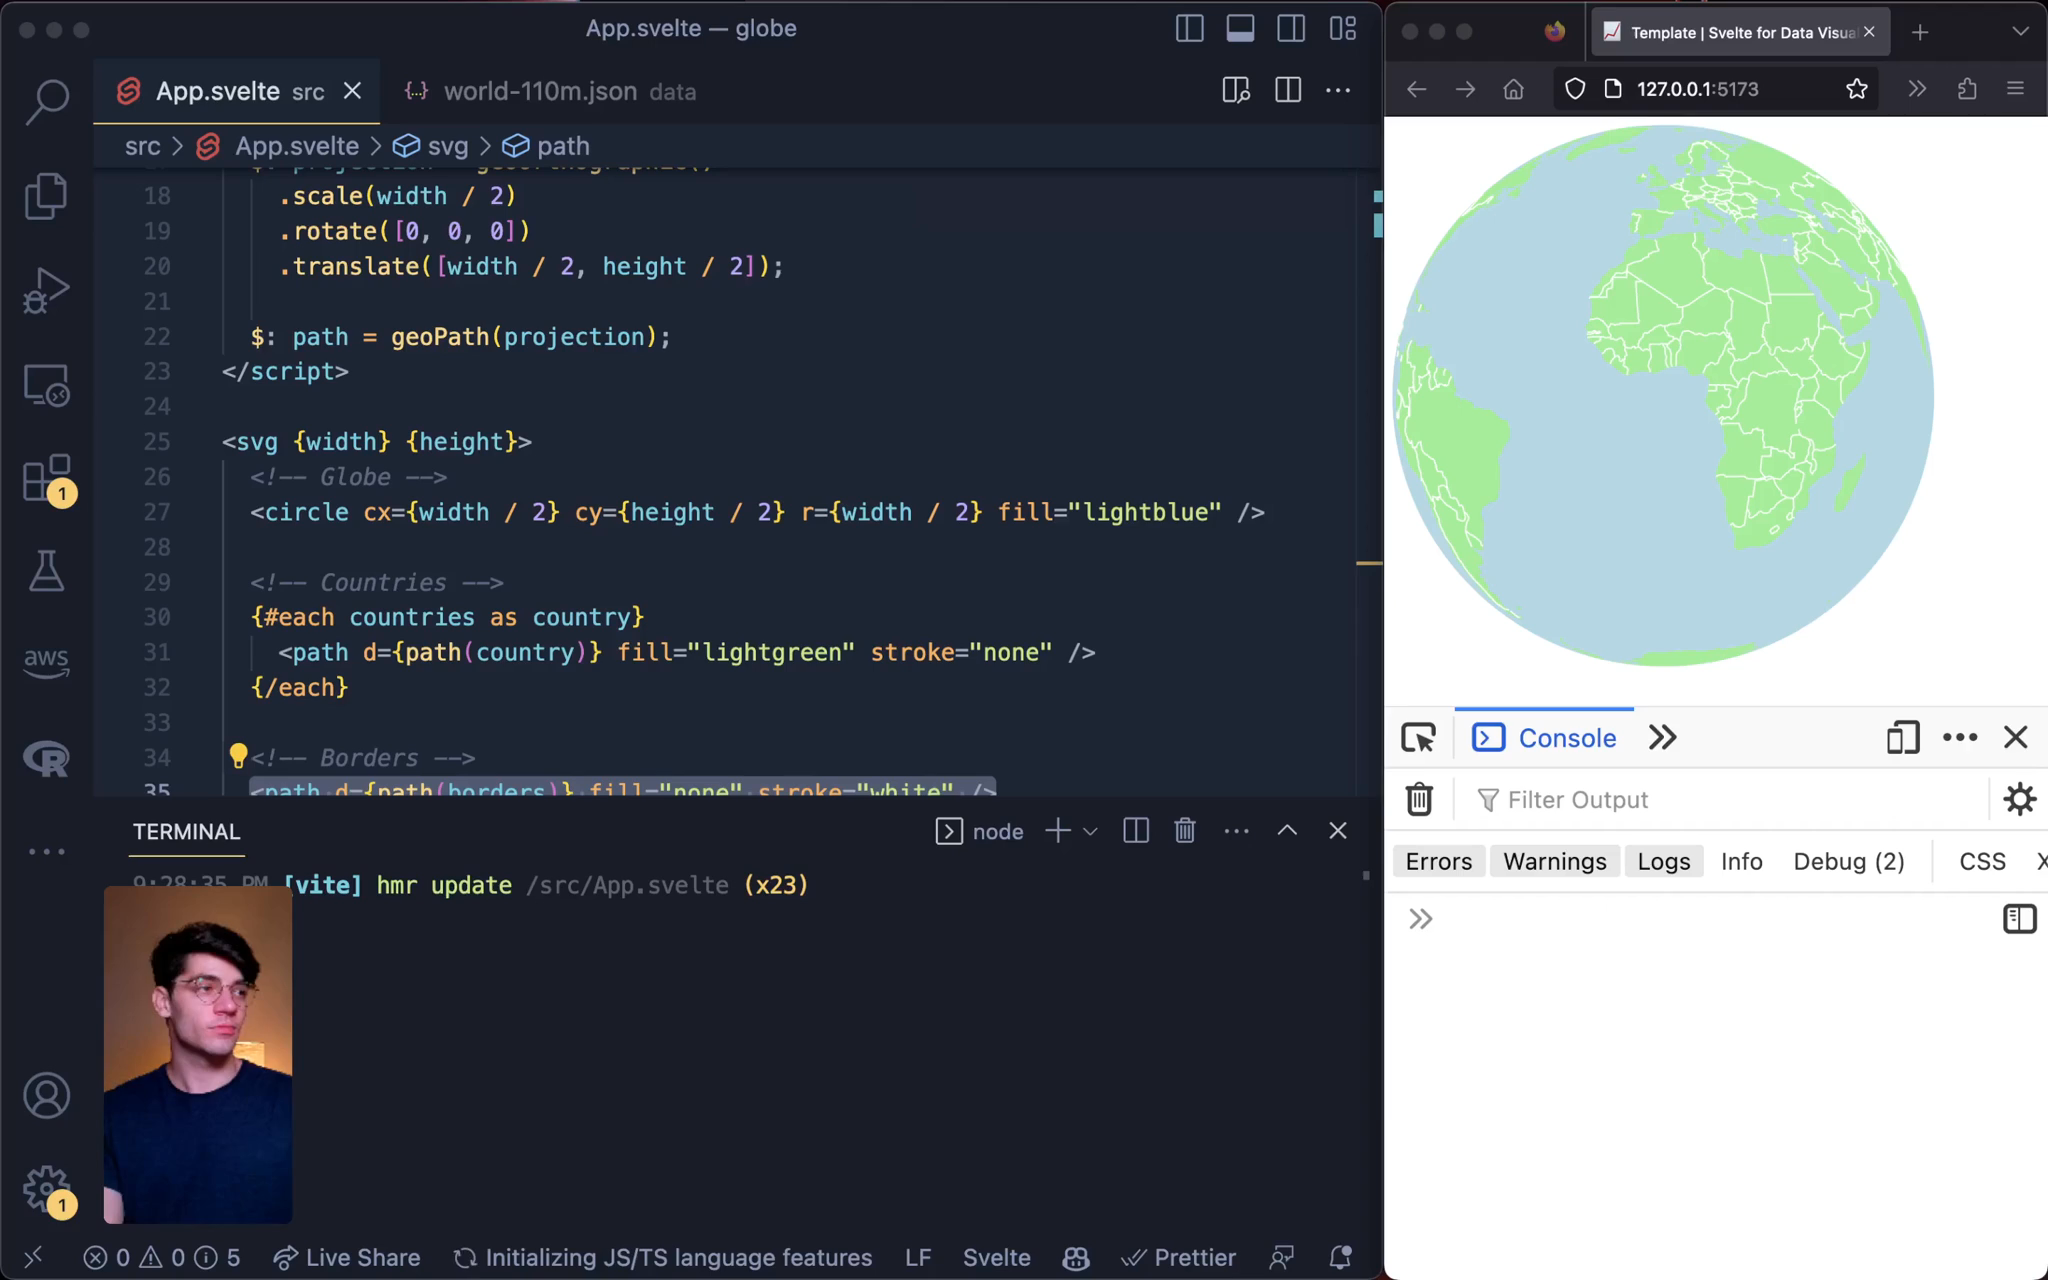
lesson
Build a Responsive Globe Visualization With Svelte Dimension BindingsBetter Data Visualizations with SvelteMaking our globe responsive
lesson
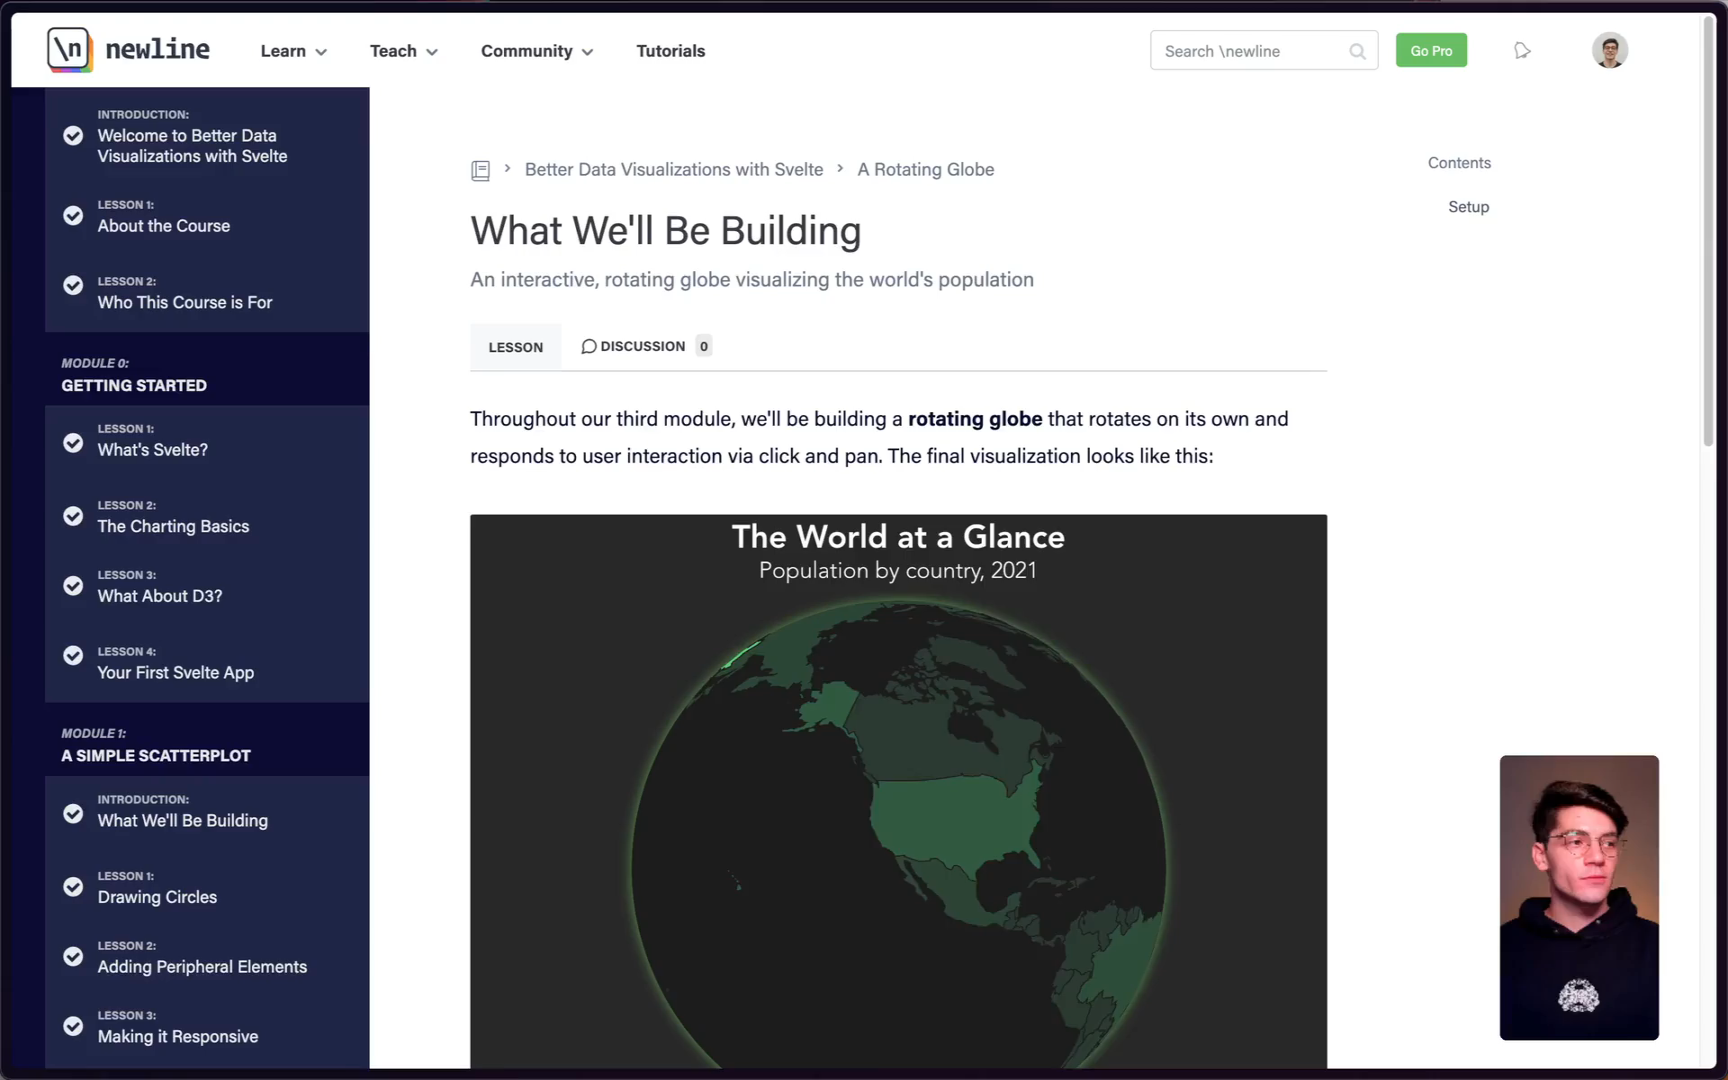
Create an Interactive Globe Visualization With Svelte + D3.jsBetter Data Visualizations with SvelteAn interactive, rotating globe visualizing the world's population
lesson
Svelte Beeswarm Walkthrough - Wrapping UpBetter Data Visualizations with SvelteFinishing up our beeswarm chart
lesson
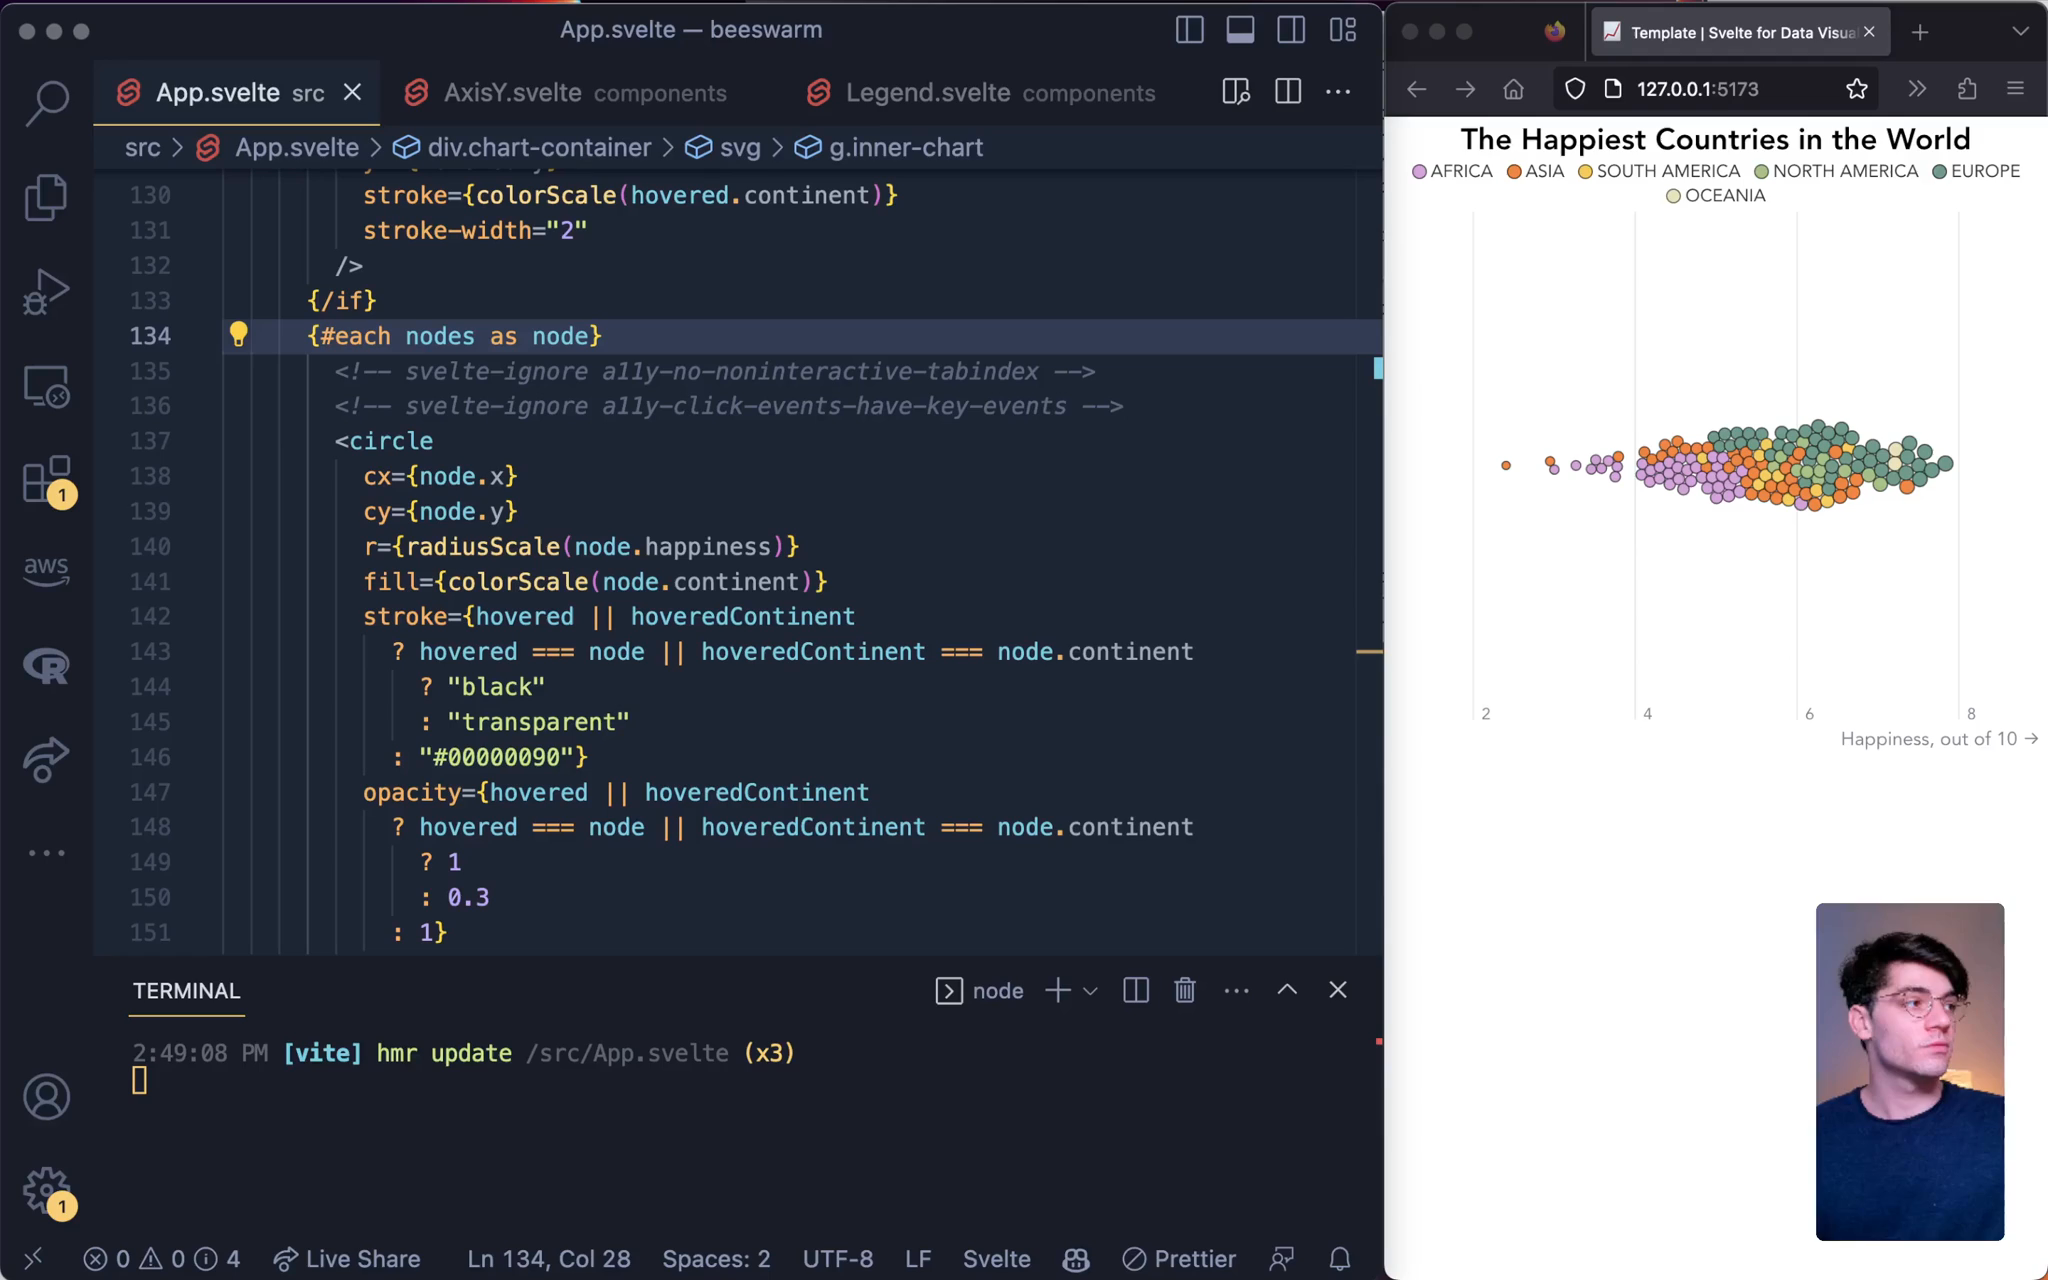
How to Add Filters and Hover Effects to Style Svelte VisualizationsBetter Data Visualizations with SvelteAdding new hover and click events to filter and style our visualization
lesson
Using the on:mouseover Event to Create Tooltips With SvelteBetter Data Visualizations with SvelteRevealing more information to the user via a tooltip
lesson
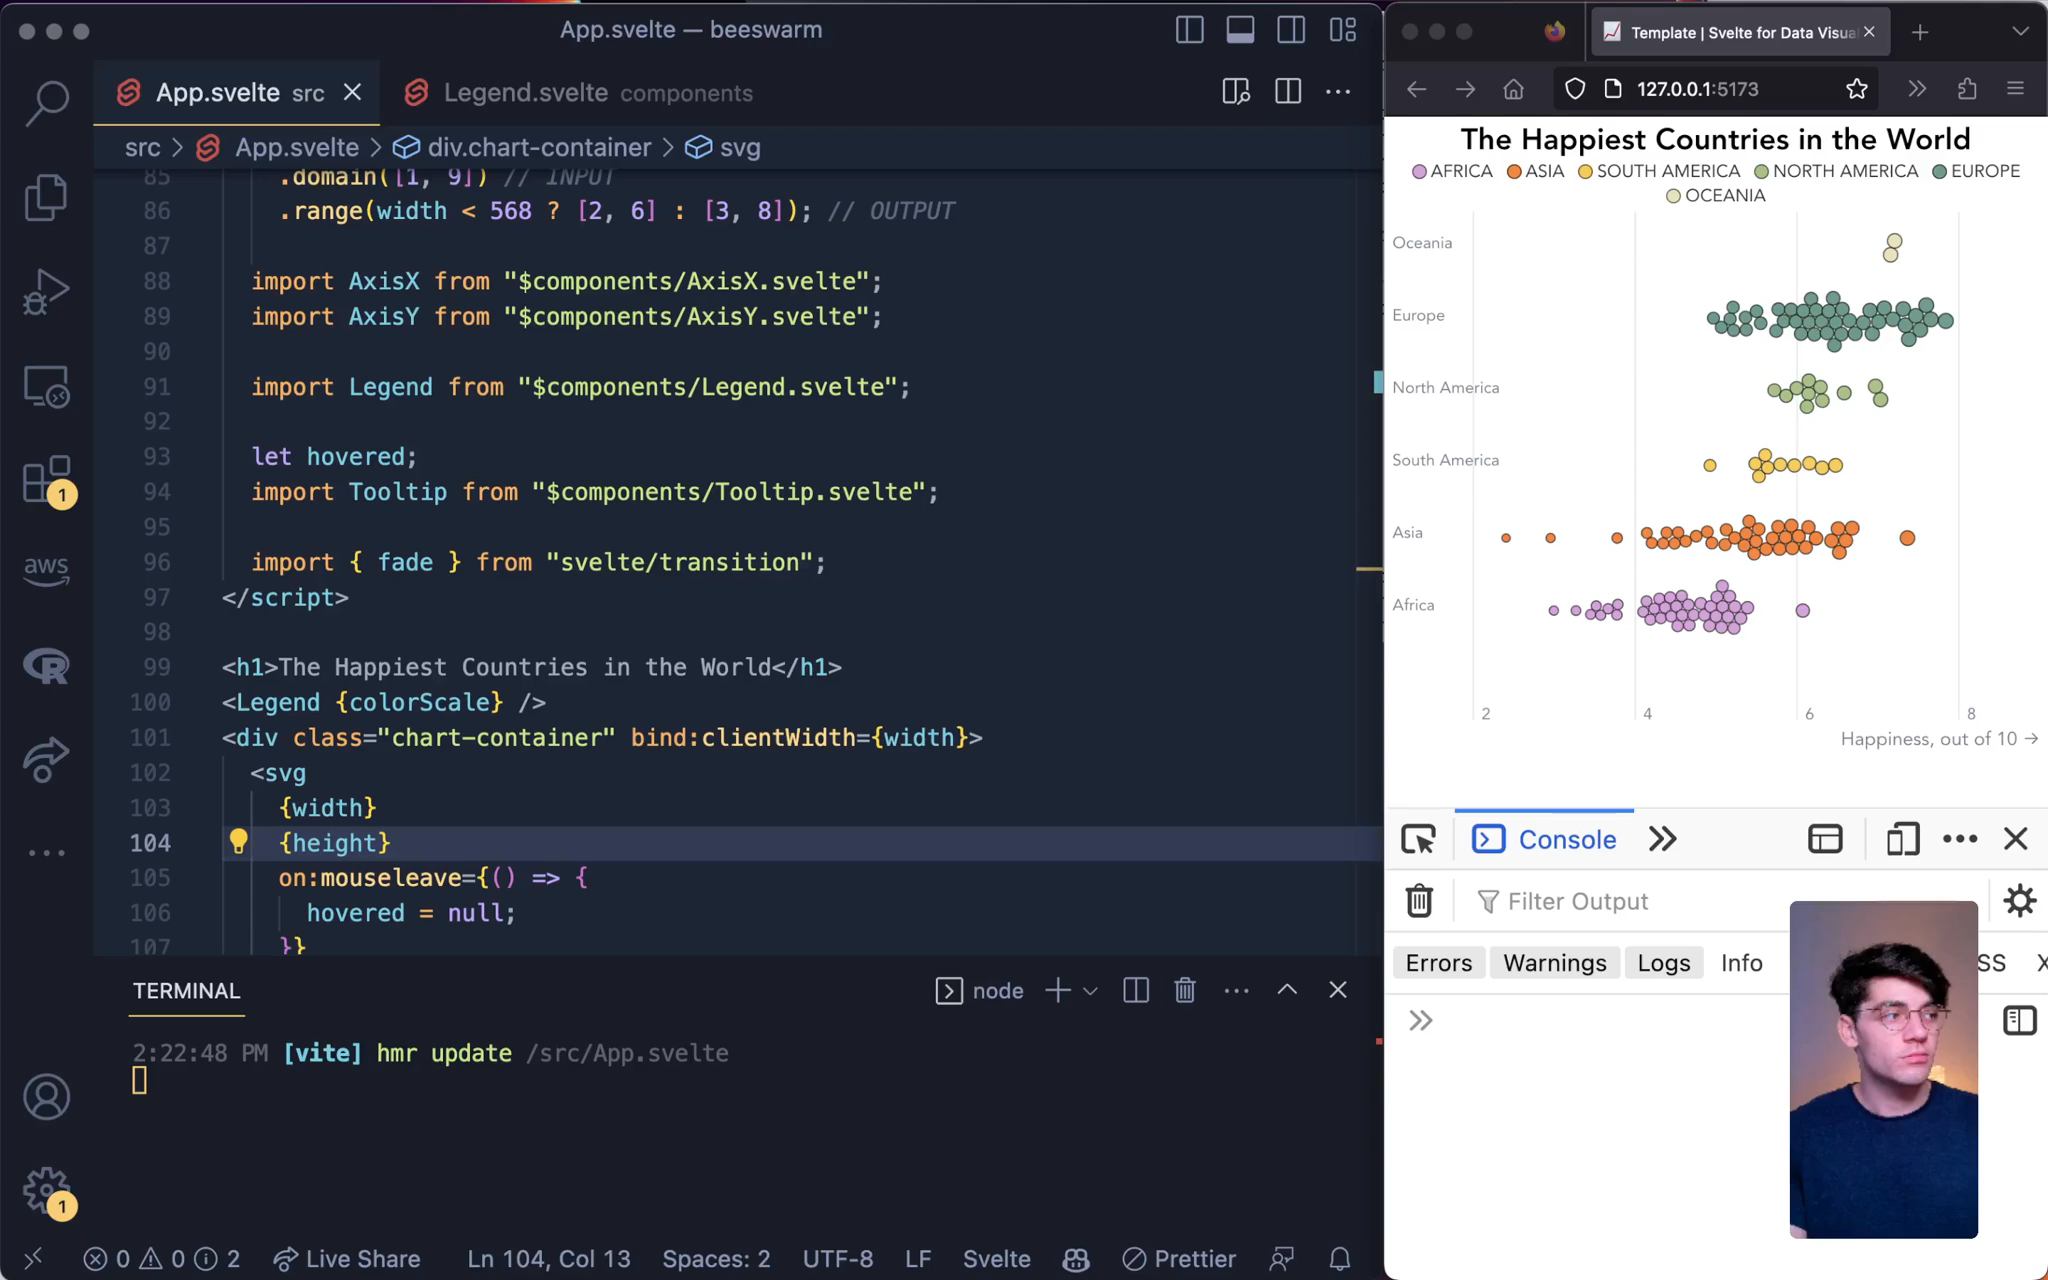
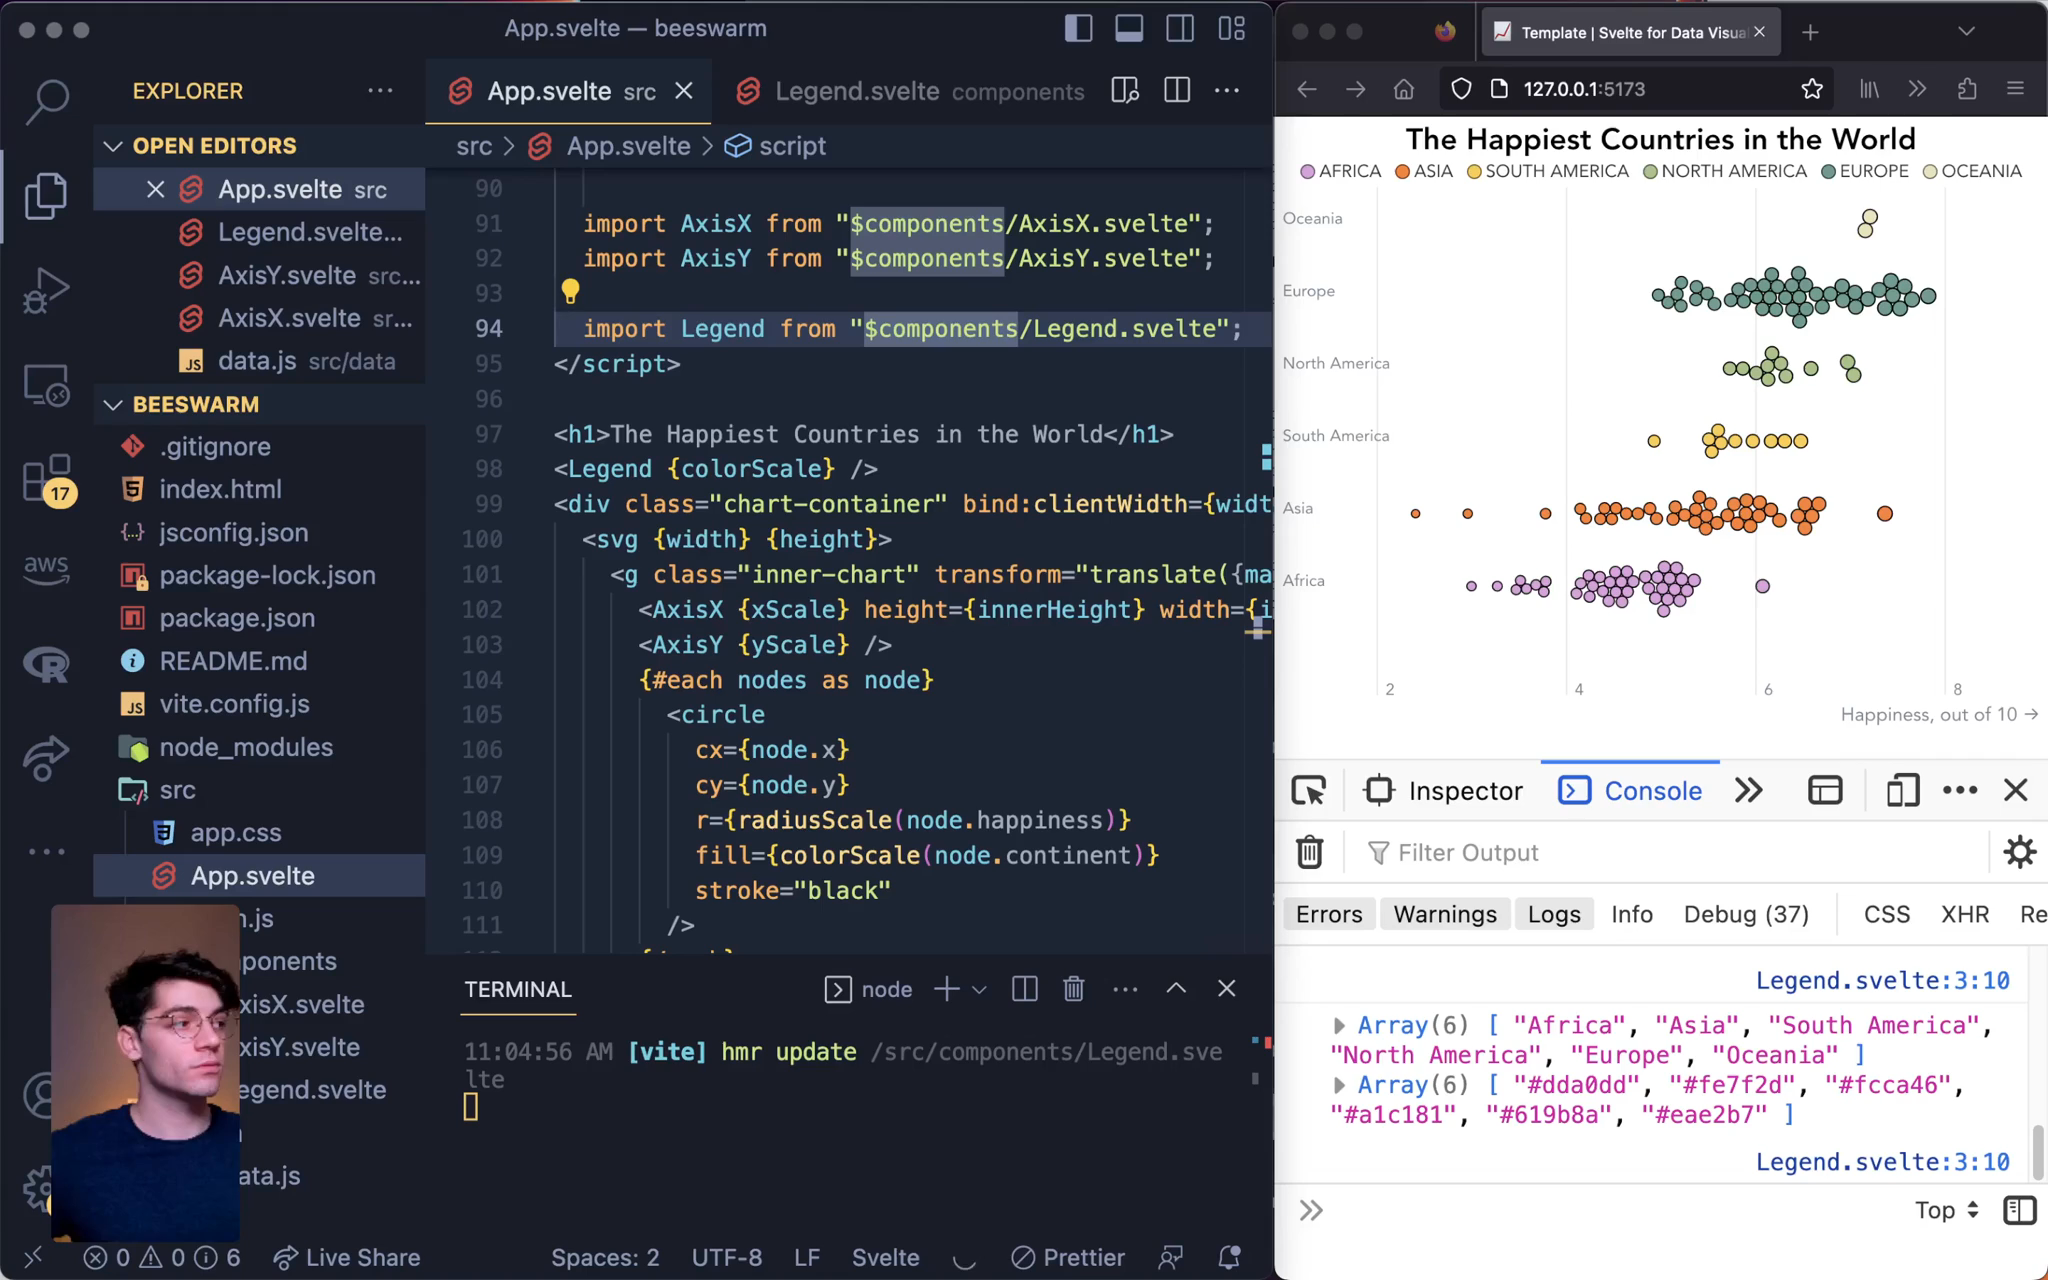
Add Axes, Titles, and Legends to Svelte Beeswarm VisualizationBetter Data Visualizations with SvelteAdding axes, titles, and a legend to our beeswarm chart

lesson
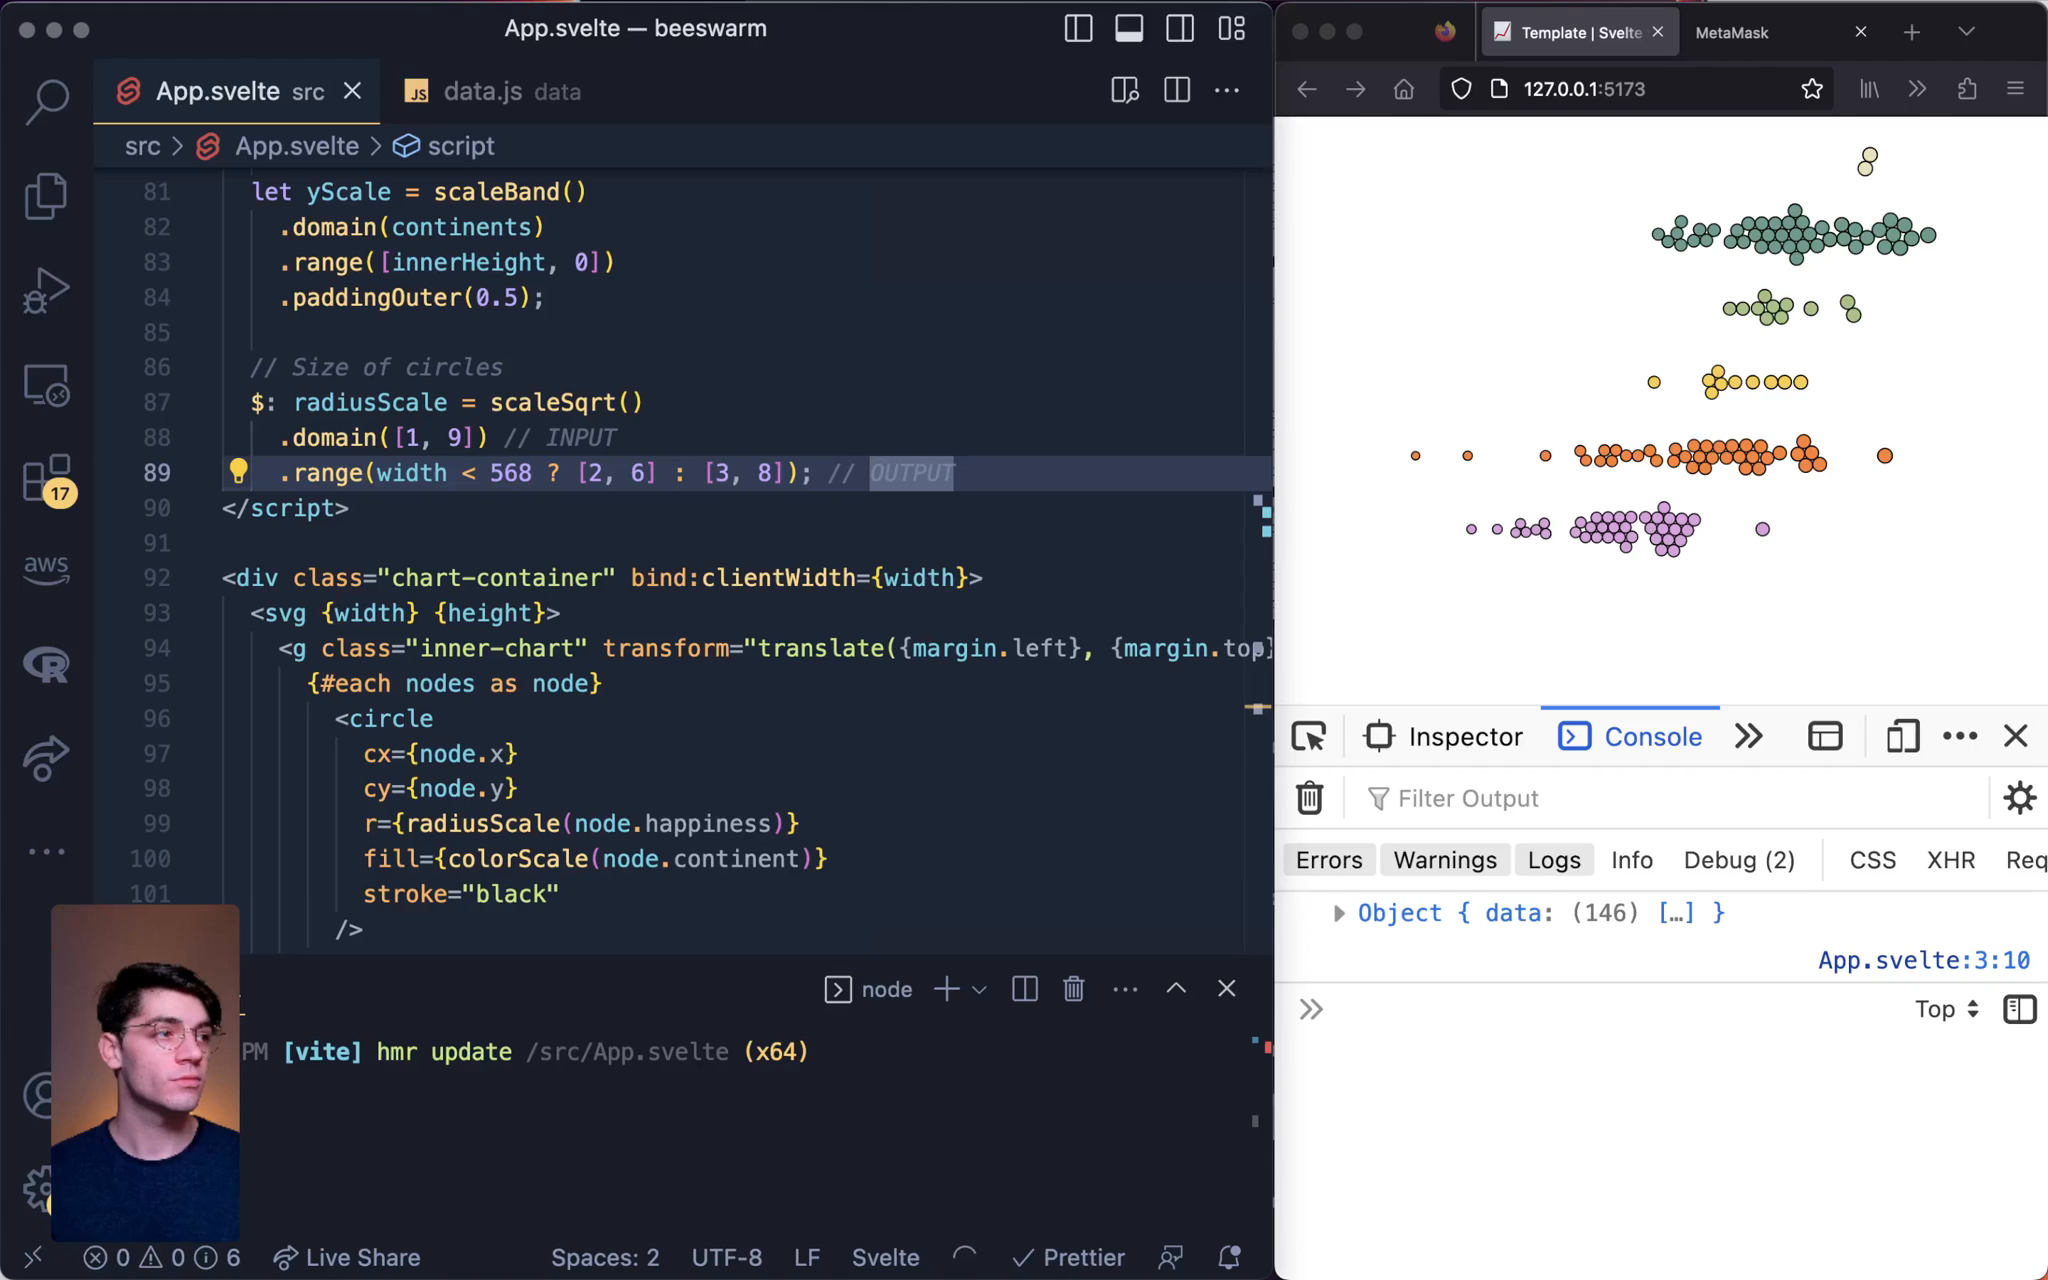
How to Build a Dynamic, Physics-Based Beeswarm PlotBetter Data Visualizations with SvelteA dynamic, physics-based beeswarm visualizing happiness by country

Articles
view all ⭢web_applications
wai_aria
web_accessibility
user_experience
web_development
web_accessibility
user_experience
html
ui_development
web_development
web_accessibility
user_experience
ui_development
a11y
front_end
wai_aria
web_development
web_accessibility
aria
custom_react_hooks
typescript
typescript_library